
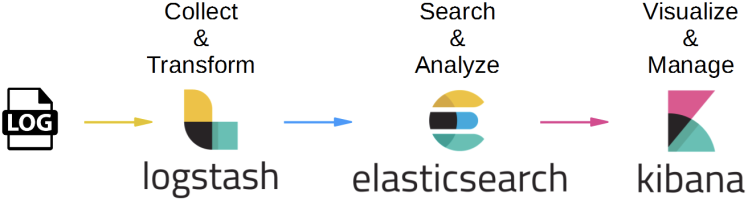
ELK(엘라스틱스택)으로 우리는 검색 뿐만 아니라 파일을 수집하고 데이터를 정형화하여 시각화할 수 있습니다.
사내에서 그동안 파일로만 쌓고 있던 에러 로그와 쿼리 로그를 수집하여 Kibana로 실시간 에러와 슬로우 쿼리를 모니터링할 수 있도록 적용하여 그 과정을 정리해보려 합니다.
엘라스틱스택으로 로그파일을 읽는다?
서버에 Filebeat를 설치하고 설정을 해주면 Filebeat는 지정한 로그 파일을 실시간으로 변경사항을 체크하여 이벤트를 수집하고 파일 내용과 offset을 Elasticsearch나 Logstash 등 원하는 output으로 전송합니다.
기본적으로 라인별로 보내지만 설정을 통하여 멀티라인으로 전송이 가능합니다.
Logstash는 Filebeat로부터 데이터를 읽어와 원하는 모양으로 가공하여 Elasticsearch로 전송합니다. 여기서 라인을 grok로 파싱해서 필드별로 식별하고, 불필요한 필드는 제거합니다.
✅ Beats와 Logstash
Filebeat란 로그와 파일을 경량화된 방식으로 전달하고 중앙 집중화하는 경량 로그 수집기입니다.
Beats는 가벼운 프로그램을 지향하기 때문에 “데이터 수집”의 목적만을 수행하는데 특화되어 있습니다.
반면 Logstash는 다양한 플러그인을 포함해 범용성이 높은 만큼 무겁게 움직입니다.
간단한 수집이라면 beats에서도 어느정도의 데이터 가공을 지원하기 때문에 beats만을 사용할 수 있지만, 좀 더 전문적이로 범용적인 대량 이벤트 가공이 필요하다면 Logstash가 적합합니다.
구조
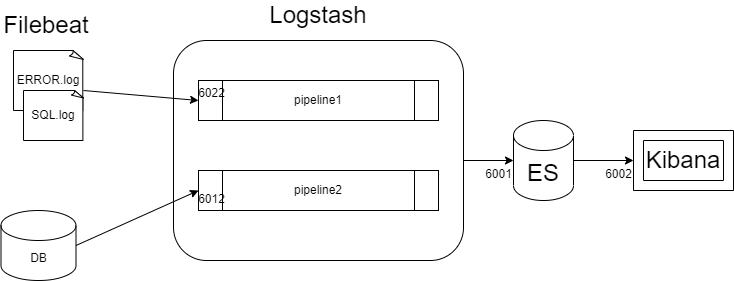
검색엔진을 사용하고 있어서 이미 DB와 연결된 Logstash pipeline이 존재한 상태였습니다.
따라서 로그 파일을 받는 pipeline을 하나 더 생성하여 ES로 보낼 수 있도록 Logstash에 다중 파이프라인 설정을 해주었습니다.
Filebeat로 로그 파일 읽기
Filebeat 설치
Filebeat quick start: installation and configuration | Filebeat Reference [8.6] | Elastic
공식 문서를 참고하여 설치합니다. 저는 다른 엘라스틱스택 버전과 맞추기 위해 **Filebeat 7.15.2 버전**을 설치했습니다.
Filebeat 설정
-
filebeat.yml 파일의 내용을 수정합니다
# ============================== Filebeat inputs =============================== filebeat.inputs: - type: log # Change to true to enable this input configuration. enabled: true # Paths that should be crawled and fetched. Glob based paths. paths: - [로그경로]/ERROR*.log # - /var/log/*.log #- c:\programdata\elasticsearch\logs\* ### Multiline options # Multiline can be used for log messages spanning multiple lines. This is common # for Java Stack Traces or C-Line Continuation # The regexp Pattern that has to be matched. The example pattern matches all lines starting with [ multiline.pattern: '^[#][SF]#' # Defines if the pattern set under pattern should be negated or not. Default is false. multiline.negate: true multiline.match: after # filestream is an input for collecting log messages from files. It is going to replace log input in the future. - type: filestream # Change to true to enable this input configuration. enabled: false # Paths that should be crawled and fetched. Glob based paths. paths: - /var/log/*.log # ============================== Filebeat modules ============================== filebeat.config.modules: # Glob pattern for configuration loading path: ${path.config}/modules.d/*.yml # Set to true to enable config reloading reload.enabled: false # Period on which files under path should be checked for changes #reload.period: 10s # ================================== Outputs =================================== # Configure what output to use when sending the data collected by the beat. # ---------------------------- Elasticsearch Output ---------------------------- #output.elasticsearch: # Array of hosts to connect to. # hosts: ["localhost:6001"] # Protocol - either `http` (default) or `https`. #protocol: "https" # Authentication credentials - either API key or username/password. #api_key: "id:api_key" #username: "elastic" #password: "changeme" # ------------------------------ Logstash Output ------------------------------- output.logstash: # The Logstash hosts hosts: ["localhost:6022"] # ======================= Elasticsearch template setting ======================= setup.template.settings: index.number_of_shards: 1 #index.codec: best_compression #_source.enabled: false # =================================== Kibana =================================== # Starting with Beats version 6.0.0, the dashboards are loaded via the Kibana API. # This requires a Kibana endpoint configuration. setup.kibana: host: "localhost:6002" # ================================= Processors ================================= processors: - add_host_metadata: when.not.contains.tags: forwarded - add_cloud_metadata: ~ - add_docker_metadata: ~ - add_kubernetes_metadata: ~- multi line 설정 : 이를 설정하지 않으면 로그파일을 한 줄 씩 전송하기 때문에 한 건의 에러 로그가 한 줄씩, 로그의 라인수만큼 ES에 쌓이게 됩니다. 따라서,
멀티 라인 설정과패턴 정규식을 이용하여 로그의 범위를 정해주어야 합니다.- 다행히 사내 로그는 모든 로그의 형식이 한 가지로 일정하기 때문에
패턴을 명시하였습니다. 만약 다양한 패턴이었다면 logback의 appender에 json 형태로 로그를 적재하여 ES로 바로 쏘는 형식을 사용할 수 있습니다.
- 다행히 사내 로그는 모든 로그의 형식이 한 가지로 일정하기 때문에
- Logstash로 거치도록 변경했기 때문에 Output설정을 output.logstash: hosts: [“localhost:6022”] 로 설정합니다.
- 포트번호 6022는 임의로 지정했습니다. 후에 Logstash에서 이 포트번호로 입력을 받습니다. ( 참고로 검색엔진 로그스태시 포트는 6012)
- multi line 설정 : 이를 설정하지 않으면 로그파일을 한 줄 씩 전송하기 때문에 한 건의 에러 로그가 한 줄씩, 로그의 라인수만큼 ES에 쌓이게 됩니다. 따라서,
-
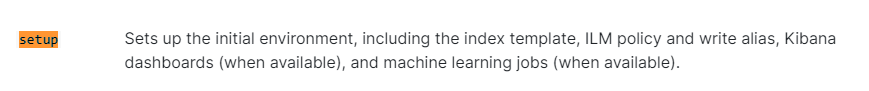
초기 환경 설정 ( 초기 한 번 )
./filebeat setup -eFilebeat는 Elasticsearch로 색인 시 권장되는 인덱스 구성을 담은 기본 인덱스 템플릿, 인덱스 수명 주기 관리 정책, Kibana 대시보드 등을 불러와 설정합니다.
Logstash에서 시각화할 데이터만 뽑아 재구성하기
에러 로그 filebeat의 파이프라인 설정
새로 추가할 파이프라인을 설정합니다. 이름은 임의로 logstash_err.conf 로 하였습니다.
[Logstash경로]/config/logstash_err.conf
input {
    beats {
        port => 6022
    }
}

filter {

}

output {
        elasticsearch {
                hosts => ["localhost:6001"]
                index => "filebeat-err"
        }
}
pipelines 설정
앞서 설정한 파이프라인과 기존에 존재하던 파이프라인을 함께 설정합니다.
pipeline.id는 유니크한 값이어야 합니다.
[Logstash경로]/config/pipelines.yml
# List of pipelines to be loaded by Logstash
#
# This document must be a list of dictionaries/hashes, where the keys/values are pipeline settings.
# Default values for omitted settings are read from the `logstash.yml` file.
# When declaring multiple pipelines, each MUST have its own `pipeline.id`.
#
# Example of two pipelines:
#
 - pipeline.id: pipe-1
   path.config: "[로그스태시 경로]/config/logstash.conf"
 - pipeline.id: pipe-2
   path.config: "[로그스태시 경로]/config/logstash_err.conf"

# ... 후략
- id와 경로는 각자에 맞게 변경하여 설정합니다
로그스태시 실행
- 🪴 Logstash와 filebeat 실행 순서
Logstash를 먼저 실행하여 대기 상태로 만든 후 filebeat를 실행합니다.
실행은 다중 파이프라인으로 로그스태시가 실행되어야 합니다.
따라서 기존에는 다음과 같이 설정파일을 지정해서 실행했지만
nohup bin/logstash -f ./config/logstash.conf &
이제는 다중 파이프라인의 속성을 읽어서 실행해야 합니다. -f 옵션을 주지 않으면 기본값으로 pipelines 설정을 읽습니다.
nohup bin/logstash &
Filebeat실행
설정 후 최초에 권한을 부여합니다.
sudo chown root filebeat.yml
sudo ./filebeat run &
Kibana로 시각화하기
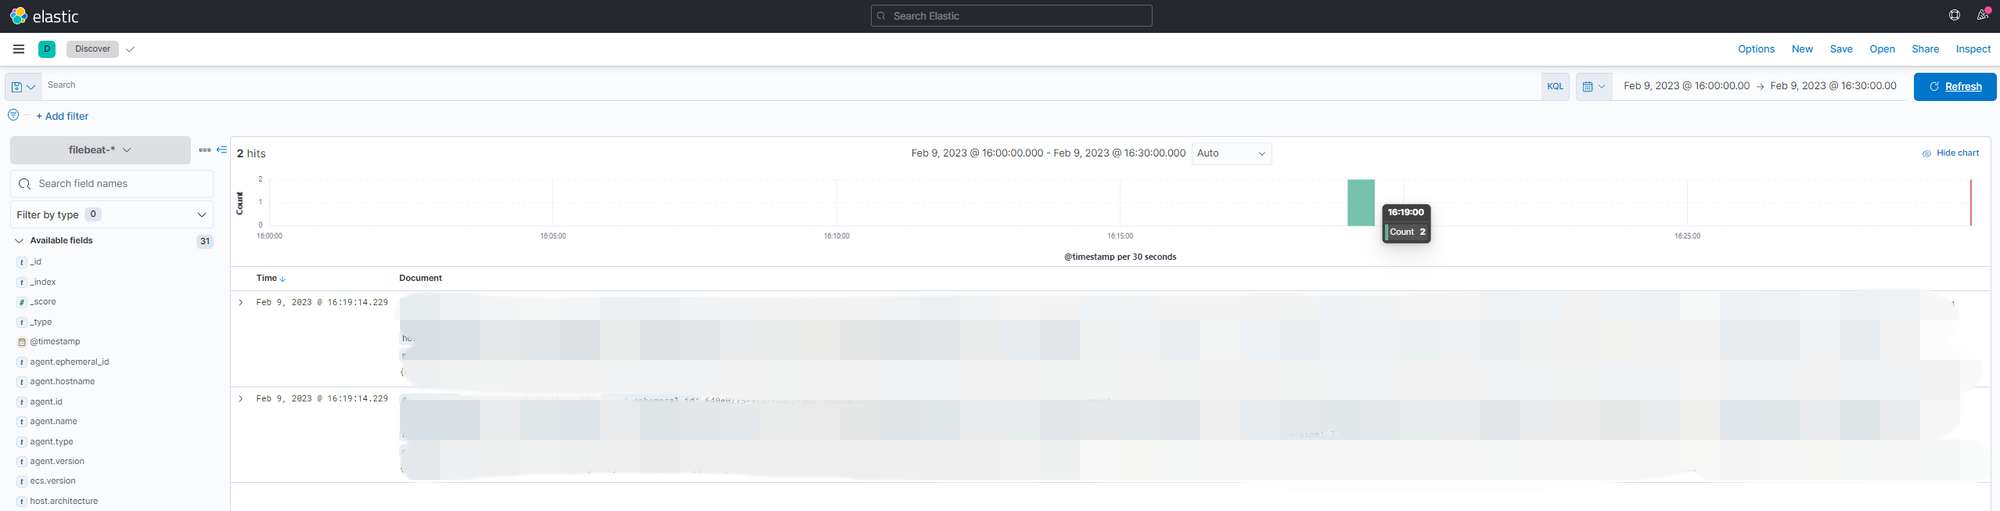
웹브라우저로 키바나에 접속합니다.
Analytics > Discover 에서 16:00 ~ 16:30 사이의 로그를 확인해보면 다음과 같이 두 건이 들어와 있습니다.
이러한 결과는 Observability > Logs 에서도 확인할 수 있습니다.
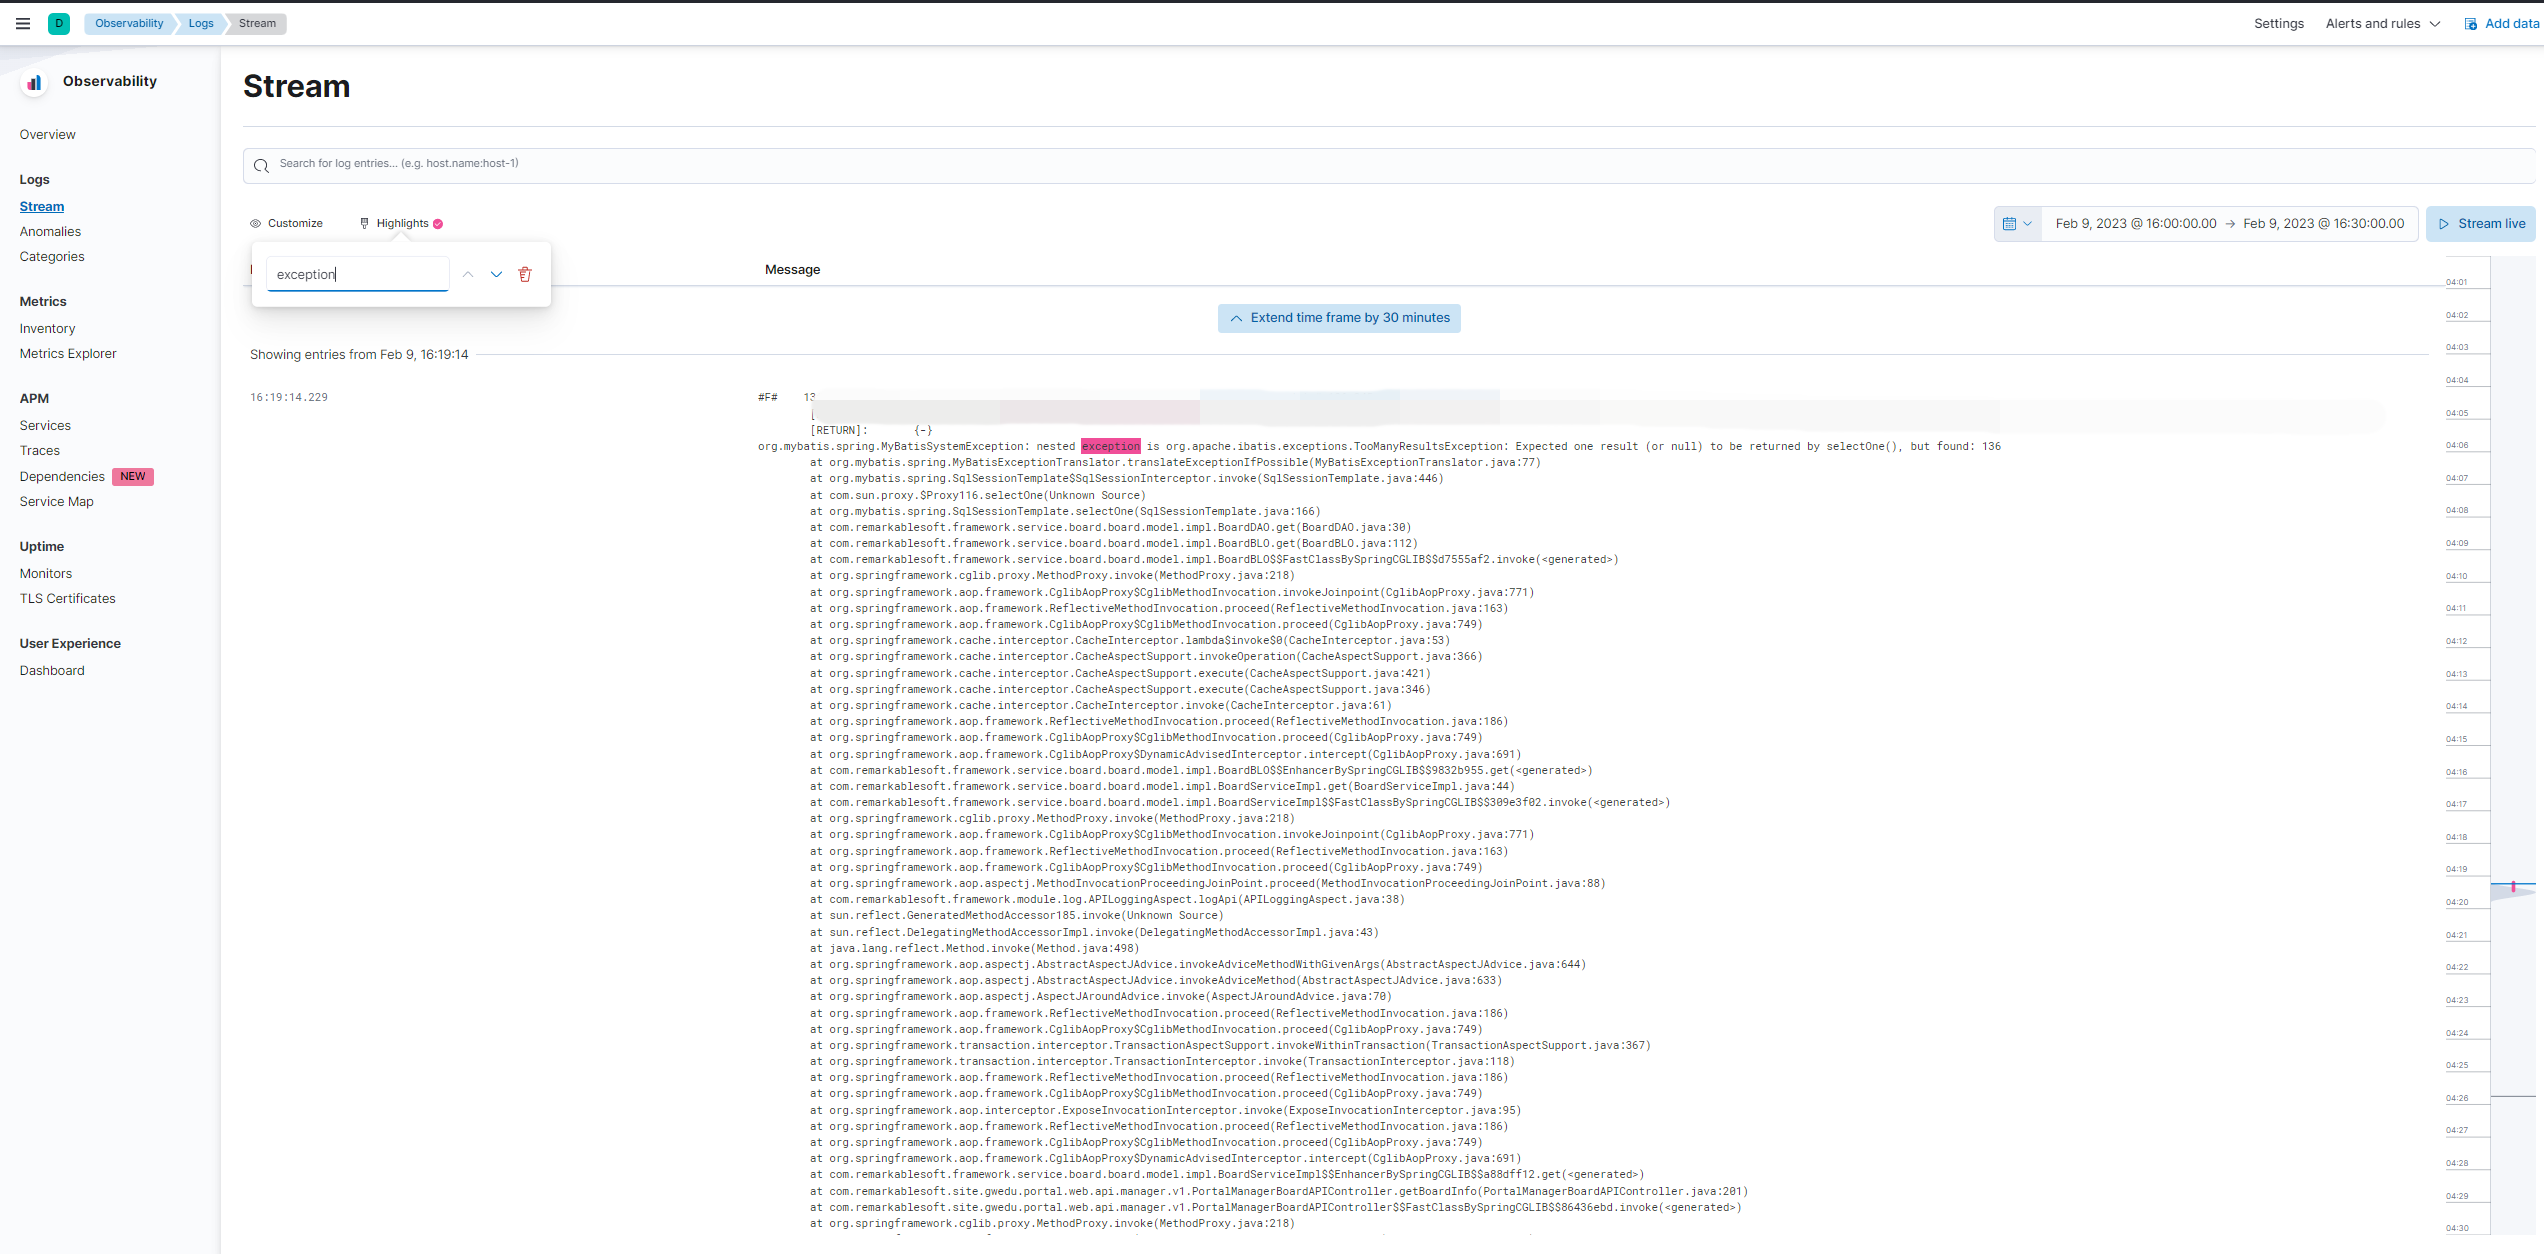
위의 화면은 Highlights에 “exception” 을 입력하여 exception 키워드에 하이라이트를 준 모습입니다.
현재 화면에서 보이는 로그는 필요하지 않은 필드도 많고, 에러메시지가 message 필드 하나에 통째로 포함되어 있습니다. 다음 포스팅에서는 수집한 로그 파일을 좀 더 명확하고 에러사항을 파악하기 쉽도록 1) 필요한 필드만 남겨두고, 2) message 필드의 값을 세부적으로 분리하겠습니다.
참고
ELK 구축 부터 log 파싱, 적재 까지 (with SpringBoot)
📚 Elastic Stack으로 내 App의 Log를 관리해보자(2) - Filebeat로 수집하고 Kibana에서 확인하기


댓글남기기